Electrician vs Plumber Salary: Which Pays More?
The two trades sit close together on national median pay, so licence level, overtime and employer type usually decide who out-earns whom in practice.
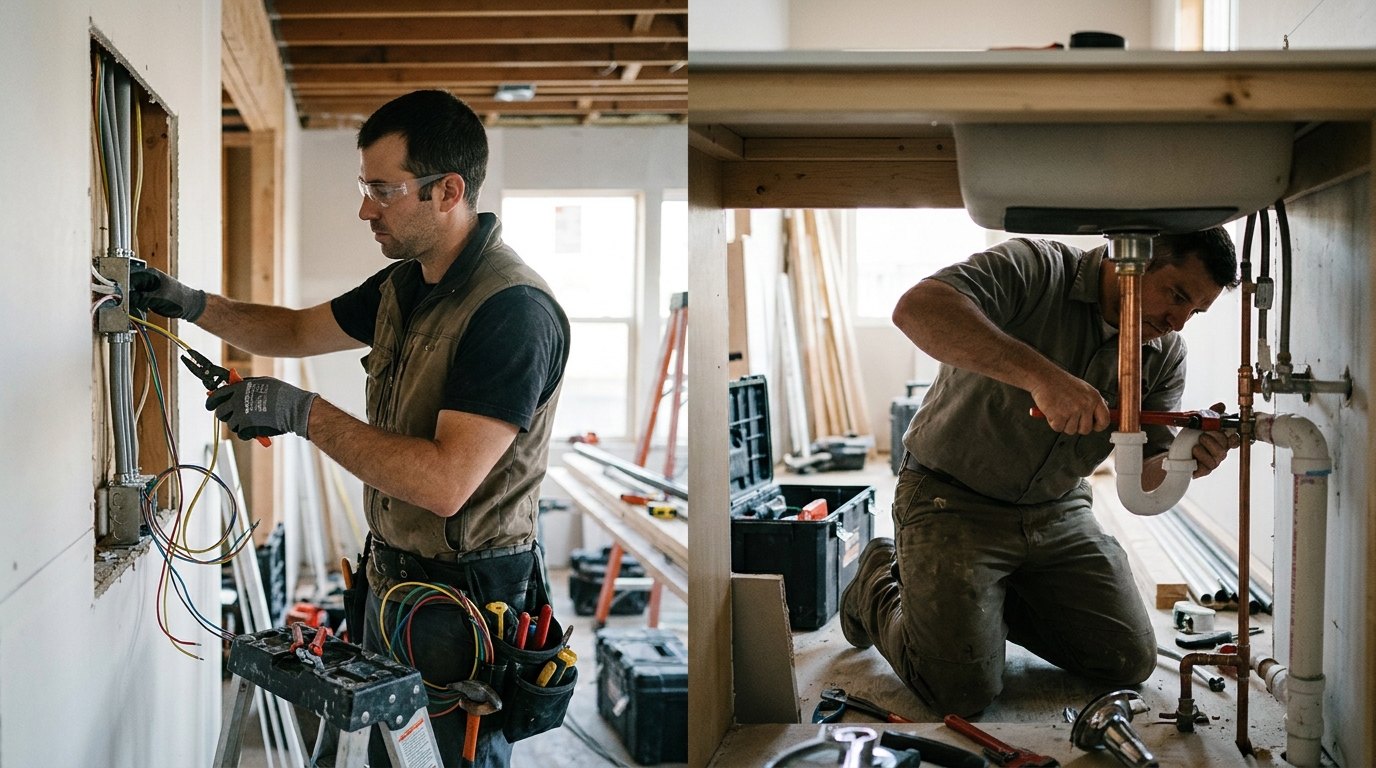
Electricians and plumbers are paid on the same broad model: a paid apprenticeship, then journey-level wages, then a premium once you hold a master licence or supervise work. The U.S. Bureau of Labor Statistics publishes a median annual wage for electricians and a separate median for plumbers, pipefitters and steamfitters (2025), and the two sit close enough that the gap between them is usually smaller than the gap between the lowest-paid and highest-paid 10 percent within either trade (U.S. Bureau of Labor Statistics, 2025).
This guide shows which figures to compare, in which release, and which factors — licence, state, overtime, employer — actually move your number. Pay figures change with every release, so read the current ones straight from the source named in each row rather than from a summary.
Salary Side by Side
Use this as a checklist of the exact figures to pull. Each row names the release that publishes it, so you are comparing like with like rather than mixing a 2025 median with an older percentile table.
| Measure | Electricians | Plumbers, pipefitters, steamfitters | Source and year |
|---|---|---|---|
| Median annual wage (median, not mean) | Published as a single national median | Published as a single national median for the combined occupation | U.S. Bureau of Labor Statistics, 2025 |
| Entry-level end (lowest 10 percent earned less than) | Published | Read from the percentile table | U.S. Bureau of Labor Statistics, 2025 (electricians); BLS percentile estimates, May 2023 (both) |
| Experienced end (highest 10 percent earned more than) | Published | Read from the percentile table | U.S. Bureau of Labor Statistics, 2025 (electricians); BLS percentile estimates, May 2023 (both) |
| Full spread (10th, 25th, 50th, 75th, 90th percentile) | Published nationally | Published nationally | U.S. Bureau of Labor Statistics percentile wage estimates, May 2023 |
| Pay by industry | Published as median annual wage by selected industry | Compare against the electrician industry table | U.S. Bureau of Labor Statistics, 2025 |
| The gap between the two | Subtract the plumber median from the electrician median in the same 2025 release; divide by the electrician median for the percentage gap | U.S. Bureau of Labor Statistics, 2025 |
Three cautions when you read those tables:
- The headline numbers are medians, not averages. Half of workers in the occupation earn more and half earn less; a mean would sit higher because the top of the range pulls it up.
- BLS publishes both hourly and annual estimates for these occupations. Do not convert between them yourself without stating your assumption — at 40 hours a week and 52 weeks a year an hourly rate multiplies by 2,080, but apprentices, seasonal shutdown work and heavy overtime all break that assumption.
- The medians are national. A state or metro figure for either trade can sit well above or below the national line, so look up your own state in the same percentile table before you treat the national median as your expected pay.
Why the Pay Differs
Four things separate the two numbers. None of them is the entry qualification.
Education requirement — close to neutral. BLS lists a high school diploma or equivalent as the typical entry-level education for electricians (2025) and the same for plumbers, pipefitters and steamfitters (2025). Neither trade carries a degree premium, so no part of the gap between the two medians is explained by schooling. What both carry instead is a multi-year apprenticeship with paid on-the-job hours each year (BLS, 2025), which means your first years are paid at a fraction of the journey rate in both trades — compare the lowest-10-percent figure for each occupation to see roughly where that early band sits.
Licensing — the clearest lever you control. Most states require electricians to pass a test and hold a licence, and the requirements vary by state (BLS, 2025). Most states and some localities require plumbers to be licensed (BLS, 2025). Because the licence gates who may sign off work, the step from apprentice to journey worker to master is the step that moves you up the percentile table. To size that in dollars, compare the 25th, 50th and 75th percentile figures for your occupation in your state (BLS percentile wage estimates, May 2023) — that span is the practical value of advancing a licence grade.
Demand — read the growth and openings figures together. BLS publishes a projected employment growth rate and a number of annual job openings for electricians (2025) and separately for plumbers, pipefitters and steamfitters (2025). The openings figure matters more than the growth rate for bargaining power: where a trade has many annual openings relative to its size, employers compete on wage and overtime. Compare the two openings figures in the 2025 release, then check your state's own projections, because a national projection does not hold evenly across states.
Employer type — the largest single swing within a trade. BLS reports the largest employers of electricians by share of jobs (2025) and the median annual wage for electricians by selected industry (2025). Reading those two tables together is the quickest way to put a dollar number on employer choice: the difference between the highest-paying listed industry and the lowest in that table is the swing available to you without changing trade at all, and it is often larger than the gap between the electrician and plumber medians.
Beyond the Paycheck
Two non-salary factors can reverse the ranking the medians give you.
Schedule and on-call work. Almost all electricians work full time, schedules may include evenings and weekends, and overtime is common (BLS, 2025). Plumbers, pipefitters and steamfitters also work full time including nights and weekends, and are often on call to handle emergencies, while self-employed plumbers may set their own schedules (BLS, 2025). This cuts both ways. If the electrician median is the higher of the two in the current release, routine overtime widens that lead in your actual paycheck. If the plumber median is higher, emergency call-outs are part of why — and the cost is unpredictable nights. The annual figures in the BLS tables include overtime earnings, so a trade that looks better paid may simply be working more hours; check the hourly estimate alongside the annual one before you treat a gap as a rate difference.
Physical demands. Electricians occasionally work in cramped spaces, spend long periods standing and kneeling, and may be required to work at great heights (BLS, 2025). Plumbing work carries its own confined-space and emergency-response element. If height work rules you out, the electrician median is not available to you in practice, however it compares — and the comparison that matters becomes plumbing against the subset of electrical work you can actually do.
Advancement ceiling. After an apprenticeship, electricians become journey workers and, with additional requirements and experience, may advance to master electrician, supervisor or project management roles (BLS, 2025). Plumbers, pipefitters and steamfitters also become journey workers after apprenticeship, and plumbers with several years of experience may earn master status by passing an exam (BLS, 2025). Electrical work's named route into supervision and project management is worth weighing if you expect to leave the tools: the 90th-percentile figure for electricians (BLS, 2025) is the upper end of the hands-on range, and supervisory or management pay is reported under different occupation codes again. A smaller median today can be worth more over twenty years if the ceiling above it is higher.
Which Pays More in Your Situation
The national medians answer the question for nobody in particular. Run the comparison that matches your case.
- If you live in a rural area or a small metro. The national medians for both occupations (U.S. Bureau of Labor Statistics, 2025) overstate pay in many non-metro areas. Pull the state and non-metropolitan-area estimates for both occupation codes from the BLS percentile wage estimates (May 2023) and compare the two 50th-percentile figures for your area. In areas with little new construction, the trade with more emergency and repair work — plumbing, which is often on call for emergencies (BLS, 2025) — tends to hold steadier hours.
- If you want to be self-employed. BLS notes that self-employed plumbers may set their own schedules (BLS, 2025), and plumbers can reach master status by passing an exam after several years of experience (BLS, 2025). Compare the 75th and 90th percentile figures for each occupation (BLS percentile wage estimates, May 2023) rather than the medians — self-employment lives in that upper band, and employee medians understate it because they exclude business profit.
- If you want the highest-paying employer, not the highest-paying trade. Open the BLS table of electricians' median annual wage by selected industry (2025) and the list of largest employers of electricians (2025). The dollar difference between the top and bottom industries in that table is the number to beat before you switch trades for pay.
- If you plan to move into supervision or project management. Electricians have a stated route from journey worker to master electrician, supervisor or project management (BLS, 2025). Compare the 90th-percentile electrician figure (BLS, 2025) with the median you would start from, and treat the difference as the ceiling you are buying.
- If licensing in your state is the obstacle. Most states require electricians to pass a test and be licensed, with requirements varying by state, and most states plus some localities license plumbers (BLS, 2025). Check your state board's requirements for both before comparing pay at all — an unlicensed route to either median does not exist in most states.
Frequently asked questions
Do electricians or plumbers earn more nationally?
Compare the median annual wage for electricians with the median annual wage for plumbers, pipefitters and steamfitters in the same U.S. Bureau of Labor Statistics release (2025). Subtract one from the other and divide by the electrician median to express the gap as a percentage. In most releases that percentage gap is smaller than the gap between the lowest 10 percent and the highest 10 percent within either occupation (BLS, 2025), which is why your licence grade and state matter more than the choice of trade.
Which trade pays more at entry level?
Both electricians and plumbers, pipefitters and steamfitters typically start in a multi-year apprenticeship with paid on-the-job hours each year (U.S. Bureau of Labor Statistics, 2025), so first-year pay sits near the bottom of each occupation's range rather than near the median. Use the lowest-10-percent figure for electricians (BLS, 2025) and the 10th-percentile figure for plumbers, pipefitters and steamfitters (BLS percentile wage estimates, May 2023) as the entry-level comparison, and the 90th-percentile figures for each as the experienced comparison — never a single typical salary for either.
Does overtime change which role pays more?
It can. Overtime is common for electricians, whose schedules may include evenings and weekends (U.S. Bureau of Labor Statistics, 2025), while plumbers, pipefitters and steamfitters work nights and weekends and are often on call for emergencies (BLS, 2025). Because BLS annual estimates reflect hours actually worked, compare the hourly median for both occupations as well as the annual median; if the annual percentage gap between the two is larger than the hourly percentage gap, the difference is hours rather than rate.
How much does my state change the answer?
Enough that the national ranking can flip. BLS publishes state and metro percentile wage estimates for both electricians and plumbers, pipefitters and steamfitters (May 2023); read the 50th-percentile figure for each occupation in your own state and compute the percentage difference there instead of relying on the national medians (BLS, 2025). Licensing adds to this, since electrician test and licence requirements vary by state and some localities license plumbers separately (BLS, 2025).
Which trade has the higher long-term ceiling?
Electricians move from journey worker to master electrician, supervisor or project management with additional requirements and experience, while plumbers reach master status by passing an exam after several years (U.S. Bureau of Labor Statistics, 2025). To compare ceilings in money, use the gap between the 50th and 90th percentile figures for each occupation (BLS percentile wage estimates, May 2023) — expressed as a percentage of each median, that spread tells you how much room the trade leaves above its midpoint.
Sources
- U.S. Bureau of Labor Statistics — Electricians : Occupational Outlook Handbook (2025)
- U.S. Bureau of Labor Statistics — Plumbers, Pipefitters, and Steamfitters : Occupational Outlook Handbook (2025)